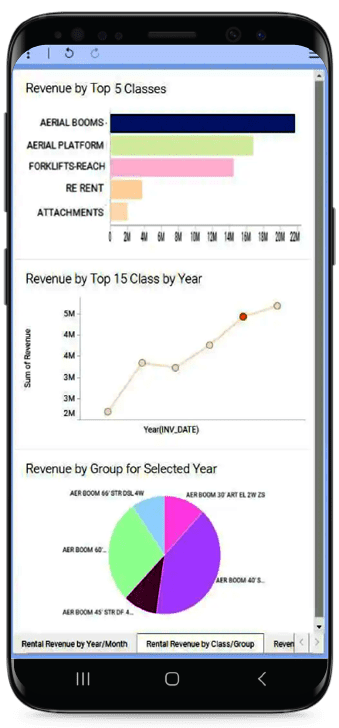
Access visualizations that show the status for your entire fleet in real-time. Asset status insights can be filtered by division.
Display the average revenue and average expense for a group. Assets can be compared with different products in a specified group.
View the average rental rate by rate code for individual groups. Average rentals reports can be filtered by division.
Visualize how much of the original equipment cost (OEC) was on contract for a given period in time for different classes and groups. OEC on contract insights can be filtered by date.
Gain visualizations to show revenue generated by invoice, both sale and rental. Sorted by division and date, the invoice history views include revenue heat maps.
Easily display the current payable amounts. Accounts payable reports can be segmented by division and vendor name.
Access visualizations showing the current receivable amounts. Accounts receivable views can be filtered by division, bill name, and age balance.
Quickly show the breakdown of general ledger components. General ledger reports are available by division.


